2 min to read
RoughViz.js - for creating sketchy/hand-drawn styled charts

Visualization through visual imagery has been an effective way to communicate both abstract and concrete ideas since the dawn of humanity. Usually we do see some cool visualizations with great look and feel. But this is an out of box JavaScript Library which helps you to plot graphs as hand-drawn charts.
What is RoughViz.js?
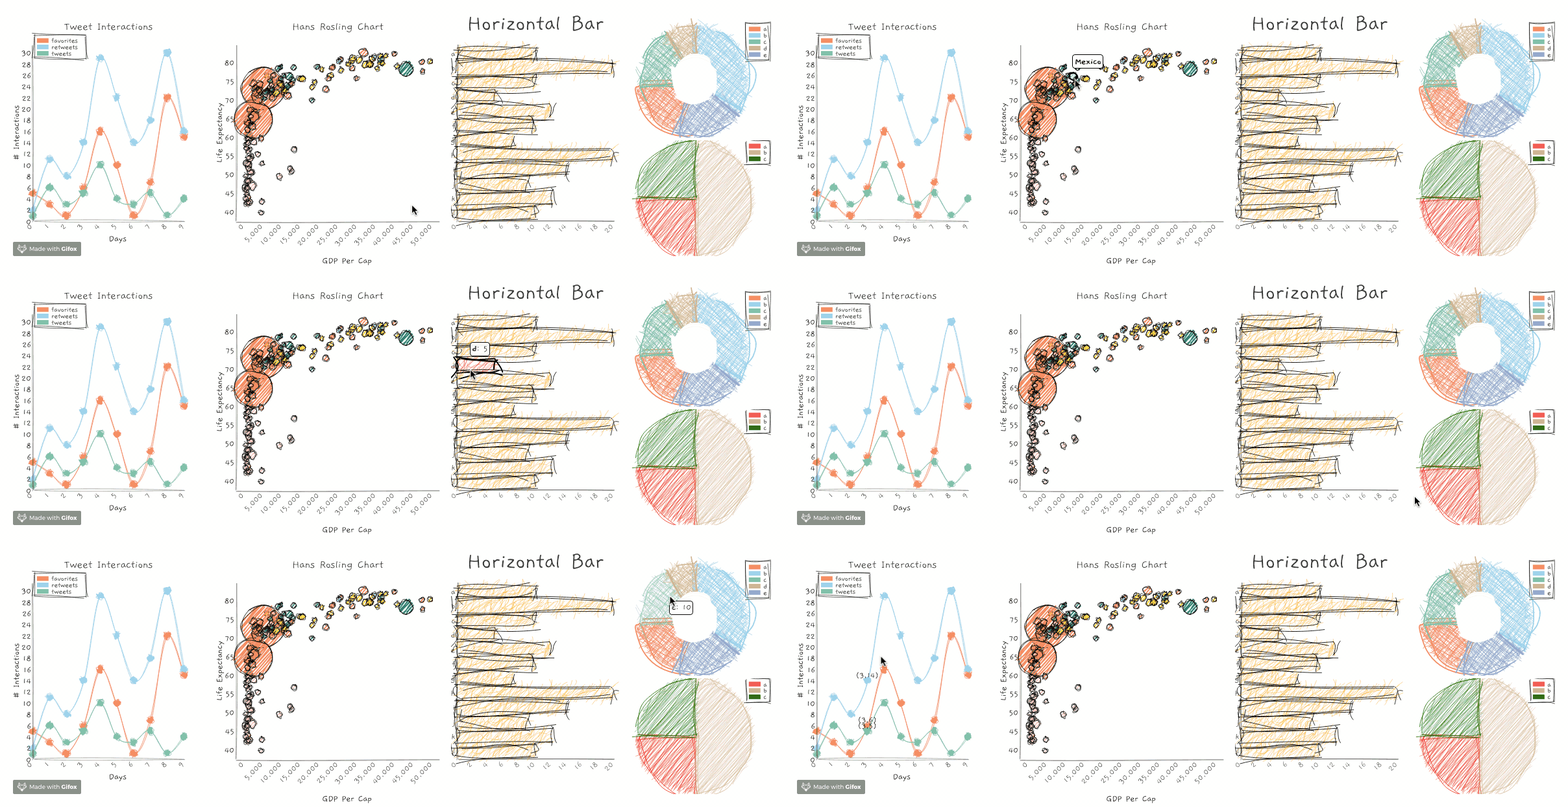
roughViz.js is a reusable JavaScript library for creating sketchy/hand-drawn styled charts in the browser, based on D3.js v5, roughjs, and handy.
See some basic examples here -

Why RoughViz.js?
Use these charts where the communication goal is to show intent or generality, and not absolute precision. Or just because they’re fun and look weird. In our view those which will look weird will get more attention first than the best one. If you can create content which looks like hand-drawn images, sure you’ll get appreciation.
Features
Chart Types (many more to come!)
- Bar (
roughViz.Bar) API. Example. - Horizontal Bar (
roughViz.BarH) API. Example. - Donut (
roughViz.Donut) API. Example. - Line (
roughViz.Line) API. Example. - Pie (
roughViz.Pie) API. Example. - Scatter (
roughViz.Scatter) API. Example. - Stacked Bar (
roughViz.StackedBar) API. Example.
Apply the features of roughjs to each chart:
-
roughness

-
fillStyle

-
fillWeight

You’ll get to know some more cool options in API Documentation.
Installation
Via CDN (expose the roughViz global in html):
<script src="https://unpkg.com/rough-viz@1.0.6"></script>
Via npm:
npm install rough-viz
Want to use with React? There’s a wrapper!:
npm install react-roughviz
Want to use with Vue? There’s a wrapper!:
npm install vue-roughviz
Want to use it with Python?
There are two options for this.
Option 1 :
pip install roughviz
Option 2 :
pip install py-roughviz
How to Contribute?
This is an open-source project by four engineers. Source is on GitHub
Share your most loved extensions and your feedback on twitter, Instagram, or mail us at support@devskrate.com. Use #DevsKrate on any social media platforms we will reach out to you.

Comments